Contents
1. Quick intro
2. Recording sound
3. Running Harmometer
4. Troubleshooting
5. Analyzing results
Appendix A. License
Appendix B. Accuracy testing
1. Quick intro
Harmometer is a program for measuring the harmonic content of sound. Complex sounds, such as the sound of a cello or
the sound of someone singing, are made up of a fundamental component plus harmonics, also called partials or overtones.
The fundamental is the lowest frequency component of the tone (as long as there are no sub-harmonics) and all the
harmonics have frequencies which are integer multiples of the fundamental. For example, a 100 Hz tone has a fundamental
component at 100 Hz, and may have harmonics at 200 Hz (the first harmonic), 300 Hz (the second harmonic), and so on.
Harmometer measures the fundamental frequency using a pitch detection algorithm and then measures the harmonics using
a simplified discrete Fourier transform at each of the harmonic frequencies. This technique is extremely accurate as
long as the pitch detection algorithm correctly identifies the fundamental (see accuracy testing).
Please look over the license before using Harmometer. Harmometer is free for non-commercial use.
Thanks are due as follows:
- Timothy J. Weber for the Wave file reading code
- Don Cross for the FFT code
- Stephan Bernsee for the code for the mapToPi function
2. Recording sound
Harmometer expects its input to be in a certain format. The program accepts Wave format files (.wav extension). Most
audio programs can record wave files, such as the Sound Recorder accessory which comes with Windows or more advanced
programs such as Audacity. The following settings are expected:
- Mono (1 channel)
- 16-bit samples
- Uncompressed (PCM)
If you're using the Sound Recorder accessory that comes with Windows, you can configure these settings as follows:
Click "File", select "Properties", click "Convert Now...", under "Format"
select "PCM", under "Attributes" select 16 bit mono with an appropriate sampling rate (recommended
values are 22.05 kHz to 48 kHz).
The sound you record must follow a specific pattern. Play a tone, then pause, then play the next tone, and so forth.
For example, you may wish to measure the change in the first harmonic with frequency. To accomplish this, you would play
a chromatic scale on the instrument, pausing between each tone. The required lengths of the tones and pauses depend on
the settings you enter when you run Harmometer. In general, using the default settings, the tone should be about one
second long and the pause should be at least half a second. These timings do NOT have to be precise, however. If you pause
for several seconds, that is okay, the silence will just be ignored. Also, if you play the tone longer, you may get a
more accurate measurement. The tone you play will be divided into small frames of 0.3 seconds each. The frames will be
measured individually and the results will be averaged. So if you play a 2 second tone, the first 0.2 seconds will be
skipped (assuming default settings), then the remaining 1.8 seconds will be divided into 6 frames. The results of each
frame will be averaged. This is why playing longer tones might result in a more accurate measurement. Each tone
should be steady and unbroken.
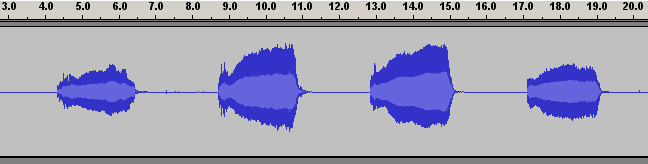
Below is a picture of an example recording (screenshot taken from Audacity). The scale above the waveform shows time
in seconds. Notice that there are tones, each a single note, separated by breaks of silence.
3. Running Harmometer
To run Harmometer, double-click on harmometer.exe. When it starts, first you will be asked to select the wave file that
you have recorded. Next you will be asked for a file name for the file to which the output will be written. Next you
will be asked if you want to modify the default settings. It is easiest to answer no, which will cause the default
settings to be used. The default settings have been selected to work correctly in most cases. However, if the pitch detection
is incorrect or you want to experiment with the settings, you will need to answer "yes" to the prompt and
proceed to modify the settings. A description of all the settings follows.
Settings
Note: For any setting, you can just press the Enter key to use the default.
- Number of harmonics to measure: This setting determines how many harmonics are measured for each tone. Entering zero means
that only the fundamental will be measured.
- Minimum tone duration: This is the duration of the shortest section of tone to analyze. This setting also determines
the size of the analysis frame. Tones will be broken up into frames of the size you enter here. Using shorter analysis frames
allows more accurate pitch tracking in case the pitch of the tone varies slightly throughout its duration. However, using too
short of a frame may result in inaccuracy. The default setting of 0.3 seconds is a good compromise.
- Note attack length: This is the length of the note attack, in seconds. The "attack" is the beginning period of
a note. During this time the instrument may produce some random noise and the tone is not stable. For example, when bowing a
stringed instrument, there is a brief crackling noise at the beginning of each note when the bow begins to move. This attack
period should be skipped because it could result in incorrect pitch detection and inaccurate harmonic measurement. The period
of time you enter here will be skipped at the beginning of each note. The default setting of 0.2 seconds is the approximate
length of the attack for a cello.
-
Peak detection threshold: This is the threshold level for peaks in the frequency spectrum. This is the most important
parameter for accurate pitch detection. If you are getting incorrect pitch detection results, try adjusting this parameter.
In general, if the pitch detected is higher than the actual pitch, then a peak is being overlooked, so try lowering this
value. If the pitch detected is lower than the actual pitch, a false peak is being detected, so try increasing this
parameter.
"Advanced" settings
In general, you can skip the advanced settings. However, you can adjust them if you wish to experiment.
- Length of break of silence: This setting determines how much silence must separate the tones.
- FFT size: This setting determines the length of the frame used for pitch detection. Using a longer frame may possibly
result in more accurate pitch detection.
- Number of samples between FFT frames: This setting is used in pitch detection.
- Silence threshold: This is the maximum sample value that will be considered "silent". The break between notes
must be silent, so the waveform must be below this value during the breaks of silence. Also, the tones must be above this
threshold to be detected.
- Minimum number of cycles: This determines the minimum frame size for low frequency tones.
- Maximum extra time: Extra time may be added to the DFT frame beyond the "minimum tone duration" setting. Allowing extra
time may improve accuracy.
- Maximum fractional cycle: This affects the accuracy of the DFT. Smaller values mean higher accuracy.
- Number of peaks: This is the number of peaks in the spectrum that will be considered when performing pitch detection.
4. Troubleshooting
Incorrect pitch detection
Error: no peaks found
No peaks were found when running the pitch detection algorithm. Try reducing the peak detection
threshold.
5. Analyzing results
After you run Harmometer, you have a text file containing the output. It is formatted with one tone per row. The columns
are separated by commas. Harmonic 0 represents the average amplitude of the fundamental, while Max Fundamental represents
the maximum amplitude of the fundamental in any one analysis frame. Following are instructions on how to import this data
into a spreadsheet.
Importing
Microsoft Excel
- Select a cell as the upper-right corner of the block into which the data will be placed.
- Click the "Data" menu, go to "Get External Data", click "Import Text File".
- Select the file and press "Open".
- Click "Next".
- Check the box labeled "Comma".
- Press "Finish". Press OK.
OpenOffice.org
- Go to File => Open.
- Under "Files of Type" select "Text CSV".
- Select the file to import and press "Open".
- Place a check mark next to "Comma" and press "OK".
- You can copy & paste the data into another spreadsheet if you want.
Quattro Pro 7
- Select a cell as the upper-right corner of the block into which the data will be placed.
- From the "Data" menu select "Text Import".
- Enter the filename or browse to find the text file output from WaveMeas.
- Select "Only Commas".
- Press OK.
Microsoft Works
- Go to File => Open.
- In "Files of Type" select "Text" or "All Files". Select the output wave file from WaveMeas.
- Press "Open".
- Select "Spreadsheet" to place the data in a spreadsheet.
- You can copy & paste the data into another spreadsheet if you want.
Transposition
The output from Harmometer has one row for each tone and one column for each harmonic. This makes it easy to plot the
harmonics as a function of the fundamental frequency. However, you may wish to reverse this so that each row contains
one harmonic and each column contains the harmonics for one tone. Switching the rows and columns is called transposition.
Following are instructions on how to transpose the data in various spreadsheet programs.
Excel
- Select the data to transpose.
- Click "Copy" on the toolbar or on the "Edit" menu.
- Click the upper-left cell of the area where you want the results to appear.
- Click the "Edit" menu and click "Paste Special".
- Place a check mark next to "Transpose".
- Press "OK".
OpenOffice.org
- Select the data to transpose (click and drag the mouse from the upper-left to the lower-right corner of the data block).
- Click "Cut" on the toolbar or on the "Edit" menu.
- Click the upper-left cell of the area where you want the results to appear.
- Click the "Edit" menu and click "Paste Special".
- Place a check mark next to "Transpose".
- Press "OK".
QuattroPro 7
- Select the block of data.
- Click "Cut" on the toolbar or on the "Edit" menu.
- Click the upper-left cell of the area where the results should appear.
- Click the "Edit" menu and click "Paste Special".
- Place a check mark next to "Transpose Rows and Columns".
- Click "Paste".
Appendix A. License
This software and documentation is copyrighted. Your use or distribution of
the software indicates your agreement with these terms.
- Software: The term "software" refers to the Harmometer program, in binary
or executable form or source code form, and the documentation.
- Non-commercial use: You may use the software free of charge for
non-commercial use. "Non-commercial" means the software may not be used to
develop or test products which will be sold, it may not be used in connection
with advertising products, and it may not be used to conduct tests for
commercial projects or commercial research.
- Distribution: You may redistribute the software under these conditions:
there will be no charge for the distribution, the software will not be
distributed in a package or disk also containing commercial software, and
the software will be distributed in its complete, unmodified form along with
all documentation and this license.
- Derivative works: You may use the software source code to create
derivative works only under these conditions: the derivative work must have a
license and the license must include section 2, "non-commercial use"
verbatim and section 3, "distribution" verbatim. The derivative work may not
be sold or distributed for a fee. The derivative work must not be distributed
under the name "Harmometer", to avoid confusion with the original version. The
license of the derivative work will obey one of the two following options:
(a) the license includes section 4, "derivative works" verbatim; or (b) the
license explicitly prohibits development of further derivative works.
- No warranty, no liability: THE SOFTWARE IS PROVIDED "AS IS", WITHOUT
WARRANTY OF ANY KIND, EXPRESS OR IMPLIED, INCLUDING BUT NOT LIMITED TO THE
WARRANTIES OF FITNESS FOR A PARTICULAR PURPOSE AND NONINFRINGEMENT. IN NO
EVENT SHALL THE AUTHORS OR COPYRIGHT HOLDERS BE LIABLE FOR ANY CLAIM,
DAMAGES, INCLUDING BUT NOT LIMITED TO DIRECT, INDIRECT, SPECIAL, OR
CONSEQUENTIAL DAMAGES, OR OTHER LIABILITY, WHETHER IN AN ACTION OF CONTRACT,
TORT OR OTHERWISE, ARISING FROM, OR IN CONNECTION WITH THE SOFTWARE, EVEN IF
ADVISED OF THE POSSIBILITY OF SUCH DAMAGES.
- Termination: This license will be terminated if you violate any of its
terms, or if you decide to terminate the license. Upon termination of the
license, you must stop using the software and delete any copies of it that you
have, and you must not distribute the software. You will cease to have the
right to create any derivative works, and any existing derivative works must
be destroyed. (This is to prevent use of derivative works outside of the terms
of this license.)
Appendix B. Accuracy testing
To test the accuracy of Harmometer, test wave files were generated with precisely known waveforms. The following table
shows that Harmometer can be extremely accurate.
| Value Name | Actual Value | Measured Value | Percent Error |
|---|
| Frequency | 100 Hz | 100.000 Hz | 0.000% |
| Harmonic 0 | 7000 | 6999.4 | -0.009% |
| Harmonic 1 | 6000 | 6000.0 | 0.000% |
| Harmonic 2 | 5000 | 4999.8 | -0.004% |
| Harmonic 3 | 4000 | 3999.9 | -0.002% |
| Harmonic 4 | 3000 | 2999.8 | -0.007% |
| Harmonic 5 | 2000 | 2000.0 | 0.000% |
| Harmonic 6 | 1000 | 999.9 | -0.010% |
| Harmonic 7 | 500 | 500.0 | 0.000% |
| Harmonic 8 | 250 | 250.0 | 0.000% |
| Harmonic 9 | 125 | 125.0 | 0.000% |
| Harmonic 10 | 62 | 61.9 | -0.161% |
Comments and questions are welcome. E-mail address: contact delete-this-before-sending _AT_ vobarian.com (Obviously, delete the extraneous words and replace _AT_ with @. This is to reduce spam.)
Mountains & clouds at top of page (clouds.jpg) taken from photo by Oswald Skene / DHD Multimedia Gallery
©2009 Chad Berchek - everything here unless otherwise noted

 Home
Home