Testing Fransys's Accuracy — also contains information on testing electronic circuits
Fransys is provided free and "as-is" for non-commercial use. By using the software, you agree to the terms of the license. Please read the full license before using the software.
Simply unzip all the files into a folder of your choice. To uninstall, just delete the folder. If Fransys is not available for your operating system, you can download the source code (see Resources) and compile it using an ANSI C++ compiler.
Fransys is a set of programs for measuring the frequency response of audio equipment connected to a computer's sound card. Many other audio analysis programs are available (see Resources), but Fransys was created to meet specific requirements:
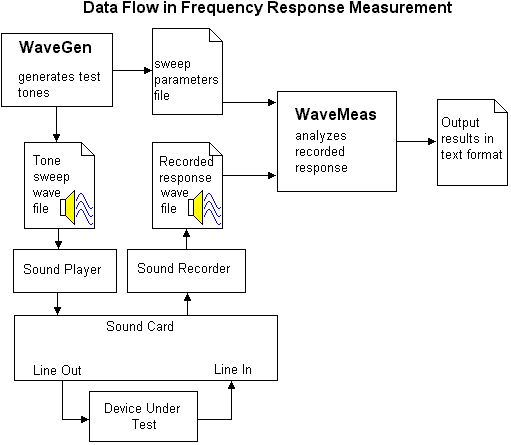
The programs use discrete sine-wave tones of different frequencies, played one after the other, making a "sweep" from the low frequency to the high. The WaveGen program generates the tone samples. WaveGen allows you to specify the parameters of the sweep and produces two files: a sweep parameters file, which contains the parameters you entered, and a Wave format sound file (typically with a .WAV extension) containing the test tones. Next, the test wave file is played out through the sound card, through the DUT (device under test), and the output is fed back to the input of the soundcard and is recorded. WaveMeas then analyzes the recorded sound and creates a text file containing the results.
The basic steps to run a test are:
Each step is covered in more detail below.
To measure the frequency response of audio equipment, an input signal is played through the equipment and the output is recorded simultaneously. The input signal is a sweep of sine-wave tones ranging from low to high frequencies. A synchronization pulse is used to mark the start of the tones in the recording. The sync pulse makes a "pop" sound when played through speakers. (Note: I have never seen equipment damaged by this synchronization pulse, and I would not expect there to be danger if the volume is set appropriately, but all responsibility for the risk and liability rests with you.)
There are two ways to play and record the sounds simultaneously. Either you can use one sound card to play and record simultaneously, or you can use two different computers, one to play and one to record. It is easiest to play the sweep and record the equipment's response simultaneously on one sound card, if your sound card has support for simultaneous playback and recording (full duplex). However, one possible source of error in this case is crosstalk between the playing and recording. If you play a sound while simultaneously recording but with nothing connected to the line-in, you will probably be able to see a very small amplitude signal in the recording which is interference from the playback. The effect is usually greater at higher frequencies. This effect is not very large, but if you are concerned with getting the highest accuracy, you might need to use a better sound card.
Alternatively, you can play the sweep into the equipment with one computer and record the response with another computer (or another sound card in the same computer). However, the two sound cards will not have exactly the same sampling rate. For example, even if you play and record at 44.1 kHz, the sampling rates will not match exactly because the clocks on the sound cards are not perfectly matched. This variation interferes with the precise timing of the sweep, so regular re-synchronization is needed. Synchronization is achieved by inserting a pulse in the sweep wave, which will produce a "pop" when played. You will need to generate the sweep using WaveGen with slightly different parameters than if you were using just one sound card. In particular, you need to specify a number of tone samples to play following each synchronization pulse. I recommend starting at 10 tones before each re-synchronization. However you need to decrease this number if there are regular "jumps" in the results. There is more information in the section of this manual on "WaveGen" (the program for generating the test tone sweeps). Using this method, amplitude can be measured fairly accurately, but even if you set the sweep to re-synchronize after every tone, it is usually not possible to make accurate phase measurements. At higher frequencies, the phase will tend to jump around. It is easy to understand why. Consider a 15 kHz tone sampled at 44.1 kHz. If the recording were off by just one sample, it would result in a 122 degree phase shift. So, accurate phase measurements generally must be made by playing and recording simultaneously with the same sound card.
Another possibility is to make a CD containing the tone sweep. This method makes it possible to measure the frequency response of a CD player. The above paragraph about re-synchronization applies in this case too.
The first step is to generate a sweep wave file. A sweep is a set of tones (sine waves) which will be played through the audio equipment under test. You can adjust the parameters of the sweep, such as the start and end of the frequency range, the length of the tones, etc. WaveGen will produce two files: first, a wave file containing the sweep sound; second, a "sweep parameters" file which contains the parameters describing the sweep. The sweep parameters file is needed later so that the WaveMeas program can find the tones and measure them.
To save time as you enter parameters, just press <Enter> (type nothing) for any parameters you don't care about and the default will be used automatically. Under most operating systems, you should be able to press Control-C at any time to abort the program.
Here's how the program runs, step-by-step:
Finally, you'll be asked if you want to edit the "advanced options." You can usually answer "no" (press N) and skip the information below, but for reference here are the advanced options:
After a sweep wave file has been created, it must be played out through the sound card and through the audio equipment under test. The output from the audio equipment must then be recorded into another wave file while the sweep plays through the equipment. For example, if you are measuring a speaker, the sweep would be played from the computer into your amplifier, and into the speaker. Then the sound produced must be recorded using an accurate microphone.
The wave file you record must have certain format characteristics. These are:
Almost any sound recording program can be used. If you don't already have a program for recording, an excellent program to use is Audacity. Audacity is free, supports simultaneous playback and recording with one click, shows the waveform, and has a convenient level meter. If you're using Windows and you don't want to download Audacity, you can just use the "Sound Recorder" program that comes with Windows (sndrec32.exe).
If you are using the "Sound Recorder" program that comes with Windows, here are some tips:
If you are playing and recording from a single computer, or if you can access the sweep wave file over a network, you can start the recording by opening the sweep wave file and then saving it under a different name. This way the wave file will already have the correct format as described above. To run the sweep, open the sweep wave file in two different instances of "Sound Recorder." Then go to "File" and select "Save As..." to give the file a new name. This renamed file will be used to record while the other "Sound Recorder" window will play the sweep.
If you are playing and recording on two different computers, you need to set the format of the wave file before you start recording. To do so, start "Sound Recorder" and then go to "File" then click "Properties." Click "Convert Now..." Under "Format" select "PCM" and under attributes select an option which says "16 Bit, Mono" and which has a sampling rate matching the sweep wave file you will use in the test.
Some sound cards may produce a "pop" when they first start playing back a sound. The analysis program, WaveMeas, could mistake such a "pop" for the synchronization pulse. In order to prevent that mistake, it is probably best to start the playback of the sweep first and then to immediately start the recording. (The sweep wave file contains 3 seconds of silence at the beginning in order to give you time to start the recording.)
Before recording, it is important to set the right playback and recording levels. The playback level should be set so that it does not cause clipping in the device under test. A higher recording level will give you more dynamic range, but the recording level must not be so high that the waveform is clipped. The recording must be made in mono. When recording in mono, some sound cards record only the left channel, and it is possible to set the recording level so that the maximum recording level is reached. However, other sound cards take the sum of the left and right channels. This may give inaccurate results when testing stereo equipment because the performance of the left and right channels will be mixed together. Or, if only the left channel is used, the right channel input level will be zero, so it will not be possible to reach the maximum recording level. The waveform will clip but the maximum amplitude will be only 50%. This cuts the resolution of your results in half. In this case, you could either use a different sound card, or connect both the left and right channels of the sound card's line-in to a single output of the DUT. Another possibility may be to make the recording in stereo and then discard one channel before saving the Wave file.
The easiest part of the process is running WaveMeas to measure the recorded response of the audio equipment. Once you have made your recording, run WaveMeas as follows:
After entering the three filenames, WaveMeas will perform the measurement and display a "Percent Done" indicator. After it is finished, the peak recording level will be displayed. If the peak level is 100%, then it is likely that the input to your sound card when recording was too loud and clipping occurred, causing inaccurate results. So, if the peak level is 100%, you should reduce the recording level and try again. On the other hand, if the recording level is too low, the results will not reveal as much detail as they could at a higher recording level.
The output of WaveMeas is a plain text file. The file is arranged in columns, each of which is delimited by a comma and a single space. The first several lines contain information about the sweep. Following the header is the actual data, arranged in five columns: the frequency, the amplitude, the normalized amplitude, the normalized amplitude in decibels (dB), and the phase in degrees. You will probably want to import this data into a spreadsheet or graphing program for further analysis and plotting. Here are the instructions for several programs:
There are five columns of data. Each row contains the data for one tone. The "Amplitude" column contains the measured amplitude of that particular tone, expressed in the same units as the digital samples in the wave file, which are 16-bit samples. These units are fairly arbitrary but the numbers can be used to compare the volume level of different tones. The "Normalized Amplitude" is just the value of the amplitude divided by the average amplitude of all the tones. This should help reduce the dependence of the results on the recording level. For instance, if the recording level were cut in half, the actual amplitudes would change, but the normalized amplitude should remain the same. The next column shows the amplitude in decibels, relative to the average raw amplitude. This value is calculated as:
Amp[dB] = 20 ⋅ log10(amplitude / (average amplitude))
The last column is the phase in degrees. Phase shift indicates how much tones of different frequencies are delayed by the equipment through which they pass. Phase shift can be converted to a time delay, in seconds, with the formula:
timeShift[seconds] = -phase[degrees] / (360 ⋅ frequency[Hertz])
Phase shift is measured relative to the synchronization pulse. If some tone has a positive phase shift, the time delay would be negative, and that tone would arrive before a tone with a phase of zero if both were played into the DUT simultaneously.
The frequency response will depend on the device under test (DUT) and the measurement equipment. For instance, if you are interested in the frequency response of a speaker, the speaker is the DUT. The "measurement equipment" is all the other equipment in the audio chain, such as the sound card, amplifier, and microphone used in the measurement. The measurement equipment will have its own imperfections, and it is important to measure the measurement equipment itself so that you can ensure that it won't interfere with the desired data, and so you can compensate the raw data to some extent. Two approaches (that I know of) can be used to control this error. First, very accurate measurement equipment is needed if you want accurate results, which means you need a good sound card, measurement microphone, etc. But no equipment is perfect, so the second thing to do is to measure the test platform and try to compensate the results.
To compensate for the effects of the measurement equipment, first measure the frequency response of the measurement equipment by itself. Then insert the DUT into the signal chain and measure the frequency response again. You now have two sets of data—the frequency response of the measurement equipment, and secondly the frequency response of the measurement equipment plus the DUT. As an experiment, you might start by connecting a cable directly between the line-in and line-out of your sound card and measuring its frequency response. To compensate your measured data, divide each frequency's amplitude by the normalized amplitude of the measurement equipment at that frequency. Note that division is required for the amplitude when it is expressed linearly. For decibels, you would use subtraction. Also subtract the phase of the measurement equipment at each frequency from the raw phase to help remove the effect of the measurement equipment.
For example, suppose you measure the frequency response of your sound card and the normalized amplitude at 500 Hz is 0.75 (-2.5 dB) and the phase is 20 degrees. Next, you place the equipment to be tested into the signal chain and measure its frequency response. Suppose the normalized amplitude is then 1.0 (0 dB) and the phase is 22 degrees at 500 Hz. To reduce the effect of the sound card's own frequency response, divide the amplitude by the normalized amplitude of the sound card at that frequency. In this case, the corrected amplitude at 500 Hz is: 1.0 / 0.75 = 1.33 (2.5 dB). The corrected phase is 22 - 20 = 2 degrees. The new amplitude and phase represent the change caused by placing the equipment under test into the signal chain. These calculations can easily be performed in a spreadsheet using formulas. However, these corrections can only smooth out minor bumps in the frequency response of the measurement equipment. The final results still require good measurement equipment to start with.
WaveMeas expected to find more tones but the input wave file ended. Possible causes/solutions:
The synchronization pulse is used to locate the start of the tones. This pulse was not detected in the recording.
Fransys Homepage
Here you can download the Fransys source code and the latest version of Fransys.
Also you can find my e-mail address.
The WAVE File Format
Information on Wave files and source code for reading them. Fransys uses Timothy J. Weber's
wave file manipulation code.
RightMark Audio Analyzer
RMAA is a free audio analyzer with an easy-to-use interface. It measures frequency (amplitude)
response, THD, IMD, noise, and crosstalk.
Audacity
Audacity is a free program for multitrack recording. It allows you to play and record
simultaneously. It has a level meter and waveform display.
TrueRTA
TrueRTA is a real-time analyzer displaying amplitude versus frequency. Includes an oscilloscope
and function generator. A free version is available with very limited resolution.
Liberty Instruments' Praxis
More software measuring frequency response with many other features. A limited free version
is available.
Comments and questions are welcome. E-mail address: contact delete-this-before-sending _AT_ vobarian.com (Obviously, delete the extraneous words and replace _AT_ with @. This is to reduce spam.)
Mountains & clouds at top of page (clouds.jpg) taken from photo by Oswald Skene / DHD Multimedia Gallery
©2009 Chad Berchek - everything here unless otherwise noted

 Home
Home